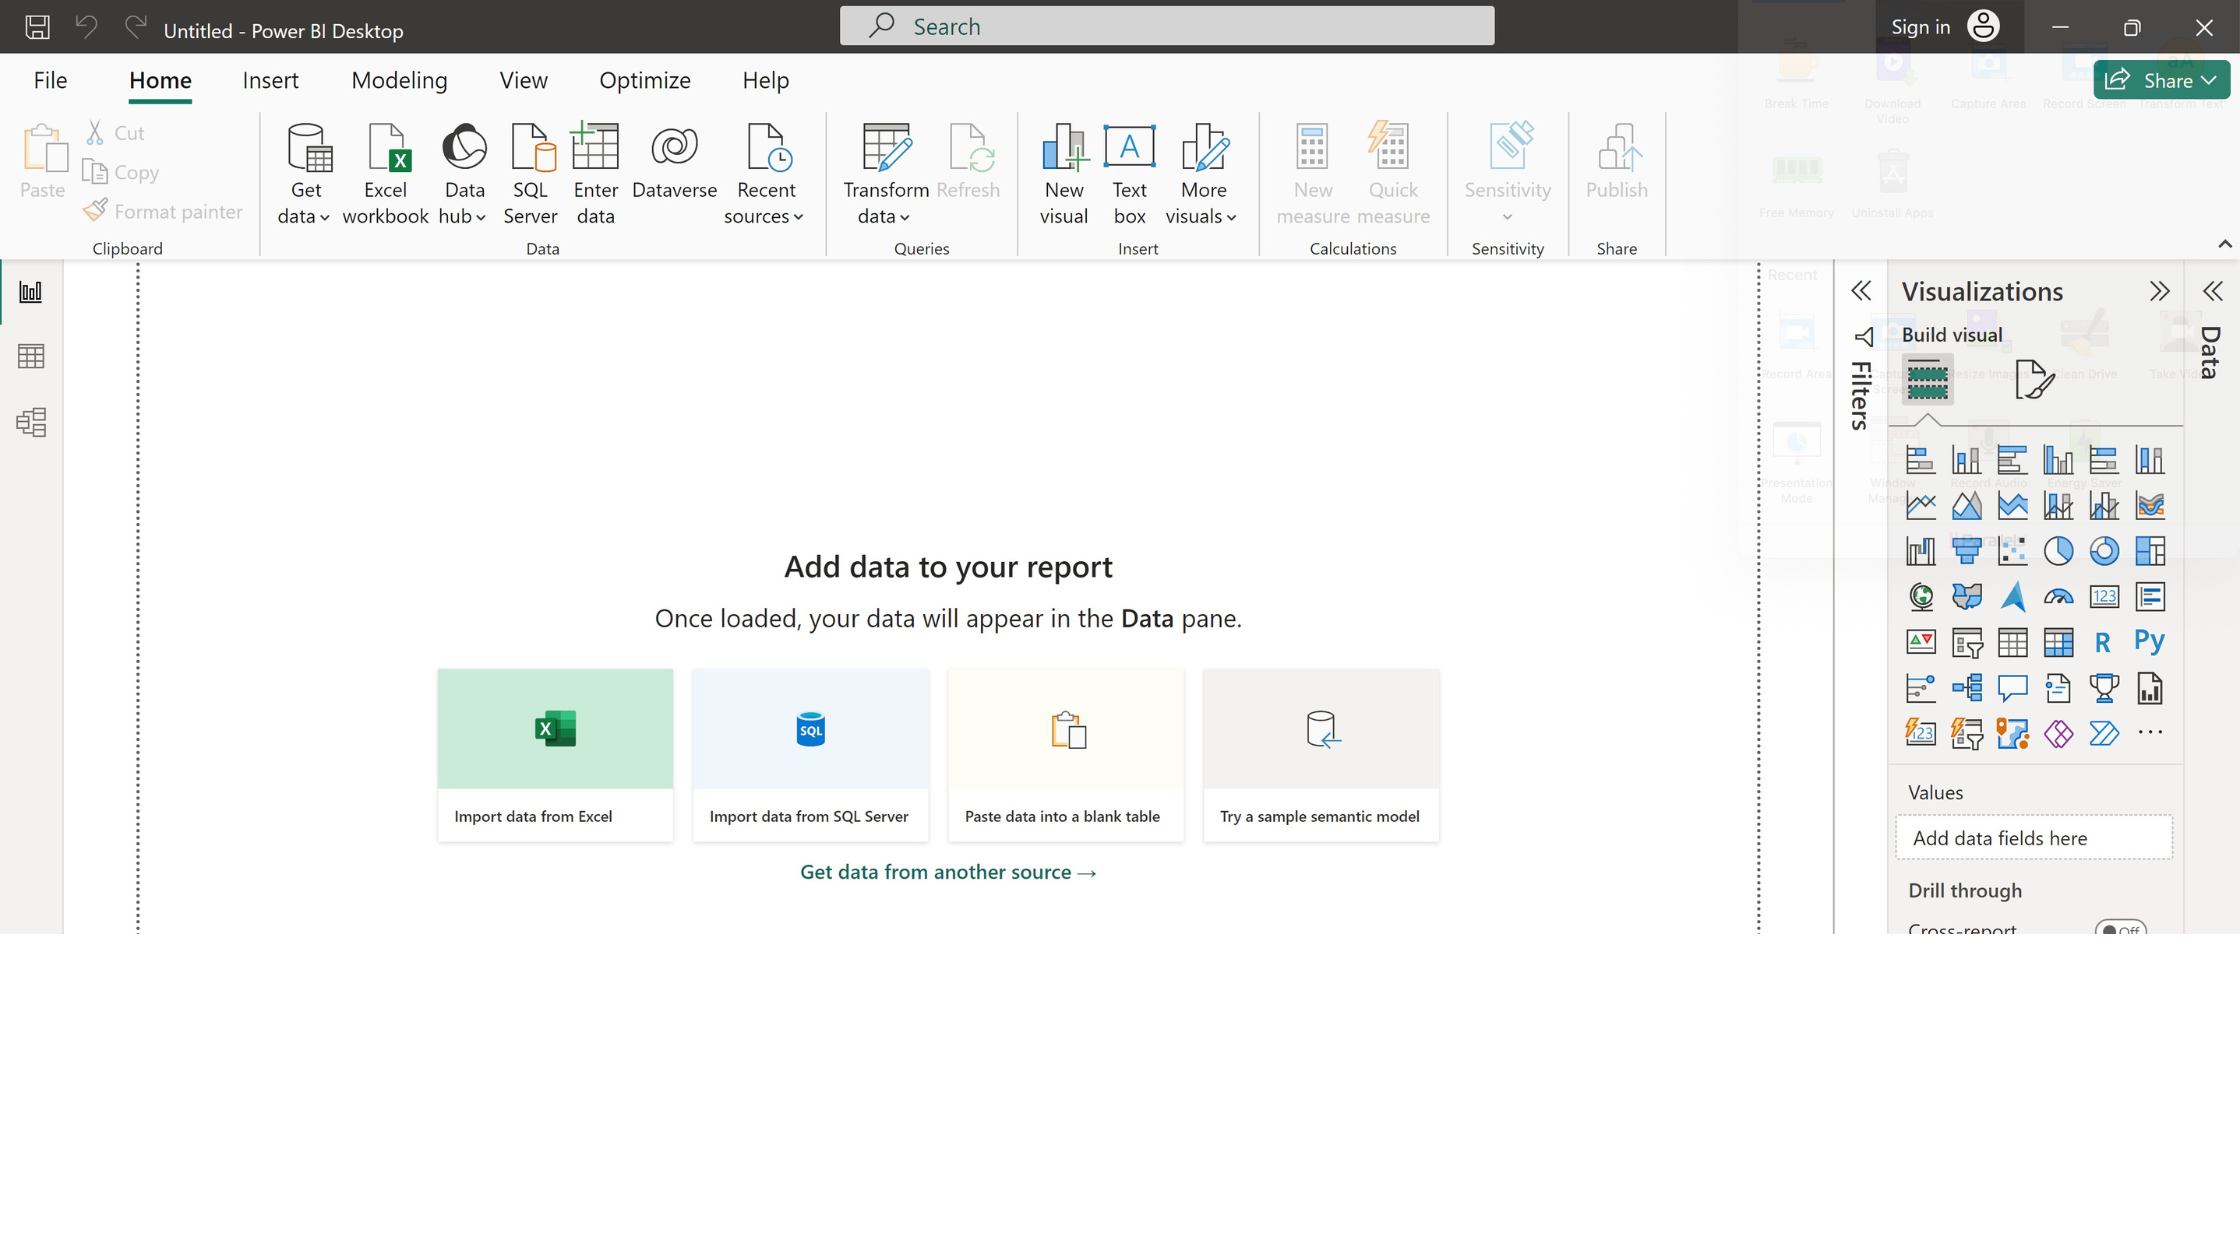
I eagerly await each new step in the convergence of Excel and PowerBI. More efficiency and productivity are the gains I foresee as a result.
As some of you know, I have designed and built full PowerBI systems with the requisite personnel to create a true business intelligence consulting service inside organizations. It goes without saying, that Excel is a cornerstone of my approach to financial forecasting and analytics. The convergence of Excel and PowerBI started out as an unintended benefit to my execution in these areas, particularly in building out finance and analytics teams. Now it’s a core part of the strategy for success at scale.
One of the main reasons I gravitated to PowerBI is the high degree of similarity it has to core Excel coding capabilities, including the advanced use of data models. I found in my experience that any of the crack Excel experts I had on staff could easily pick up PowerBI and apply their data interpretation and analysis skills at high level.
While Excel has long been the go-to tool for data analysis, reporting, and visualization, in the last few years of financial analytics, its familiarity and versatility have made it a core resource for expanding into PowerBI for business intelligence. During this same period, Power BI, Microsoft’s business intelligence platform, has gained immense popularity for its robust data modeling, interactive dashboards, and seamless integration with various data sources. The pricing and ease of implementation of PowerBI are among its other strengths.
Within the next couple of years, Excel and PowerBI personnel resources, especially in finance, will become interchangeable and extensible in their work product. One of the main drivers of this is the convergence of Excel and PowerBI coding and data handling, which I believe will be completely interchangeable.
Current Status of the Two Platforms
Data Modeling and Transformation:
- Power BI offers advanced data modeling capabilities through its Power Query Editor. Users can easily transform, clean, and shape data from multiple sources.
- Excel’s Power Query is also powerful, but Power BI takes it a step further by providing a dedicated environment for data preparation.
Interactive Visualizations:
- Power BI’s visualizations are dynamic and interactive. Users can create compelling charts, maps, and tables that respond to filters and slicers.
- Excel’s charts are static by comparison, limiting the depth of insights.
Performance and Scalability:
- Power BI is optimized for handling large datasets. It can handle millions of rows efficiently.
- Excel struggles with large datasets, especially when performing complex calculations.
Real-Time Data Refresh:
- Power BI allows scheduled or real-time data refresh from various sources (cloud services, databases, APIs).
- Excel requires manual refresh, which can be cumbersome for dynamic reports.
The Natural Convergence
Power Query Integration:
- Excel now integrates Power Query directly, bridging the gap between the two tools.
- Users can leverage Power Query transformations within Excel, making data preparation more consistent.
Power Pivot and Data Models:
- Power Pivot, available in both Excel and Power BI, enables users to create sophisticated data models.
- Excel users can build models similar to those in Power BI, enhancing analysis capabilities.
Power BI Publisher for Excel:
- This add-in allows users to publish Excel workbooks to Power BI, maintaining the interactivity of Excel charts.
- It’s a seamless way to share Excel insights within the Power BI ecosystem.
DAX (Data Analysis Expressions):
- DAX, the formula language used in Power BI, is now available in Excel.
- Users can create calculated columns and measures using DAX, enhancing Excel’s analytical capabilities.
- DAX and Excel functions will converge over time.

The Future Outlook
Unified Experience:
- Microsoft aims to provide a unified experience across Excel and Power BI.
- Expect tighter integration, shared features, and a consistent user interface.
Hybrid Solutions:
- Organizations will adopt hybrid solutions, combining Excel’s familiarity with Power BI’s power.
- Users can analyze data in Excel and visualize it in Power BI dashboards.
AI and Machine Learning:
- Both tools will incorporate AI-driven features for predictive analytics and natural language queries.
- Imagine Excel suggesting relevant visualizations or Power BI auto-generating insights.
Finance and Analytics Personnel:
- Given the versatility of each of the platforms and their closer-than-cousins future, one major benefit to companies will be the ability to hire more efficiently in finance and analytics roles.
- One platform implies skills in the other and highly skilled analysts can then focus on techniques and methods (think financial analysis, operations analysis, etc.) as opposed to platform skill development.
The convergence of Excel and Power BI is inevitable. Users will benefit from a seamless transition between the two tools, unlocking new possibilities for data analysis, reporting, and decision-making. So, whether you’re a seasoned Excel user or a Power BI enthusiast, leverage your skills by embracing the whole ecosystem to create excellent analytical tools and workproduct.
FAQs:
What are the benefits of the convergence of Excel and Power BI?
The convergence of Excel and Power BI will result in more efficiency and productivity. It will also allow for interchangeable and extensible personnel resources in finance and analytics roles.
What are the current differences between Excel and Power BI?
Power BI offers advanced data modeling capabilities, interactive visualizations, and is optimized for handling large datasets. Excel, on the other hand, has static charts and struggles with large datasets.
How are Excel and Power BI converging?
Excel and Power BI are converging through the integration of Power Query, Power Pivot, and DAX. Microsoft aims to provide a unified experience across both tools, with tighter integration, shared features, and a consistent user interface.
About Me
In my role as a CFO, I’ve steered through intricate financial problems, spearheading growth initiatives and optimizing shareholder value for various companies. Leveraging my proficiency in analytics and data science, I specialize in delivering actionable insights that inform strategic decision-making processes. Let’s connect on LinkedIn to explore how my expertise as a Fractional CFO can bolster your company’s growth trajectory with CFO PRO+Analytics

