Navigating the landscape of consumer finance, especially in the realm of excessive debt, prompts questions about the financial robustness of consumers and its potential impact on economic trends. In the post-COVID era, media discussions often revolve around the consumer savings rate, a metric influenced by stimulus measures and changing consumption patterns. However, a recent revelation, supported by alternative data points, challenges conventional perspectives on consumer finances. This analysis delves into the nuances of consumer balance sheets, exploring the interplay between savings rates and the substantial cash build-up in checking accounts.
Alternative Data Insights:
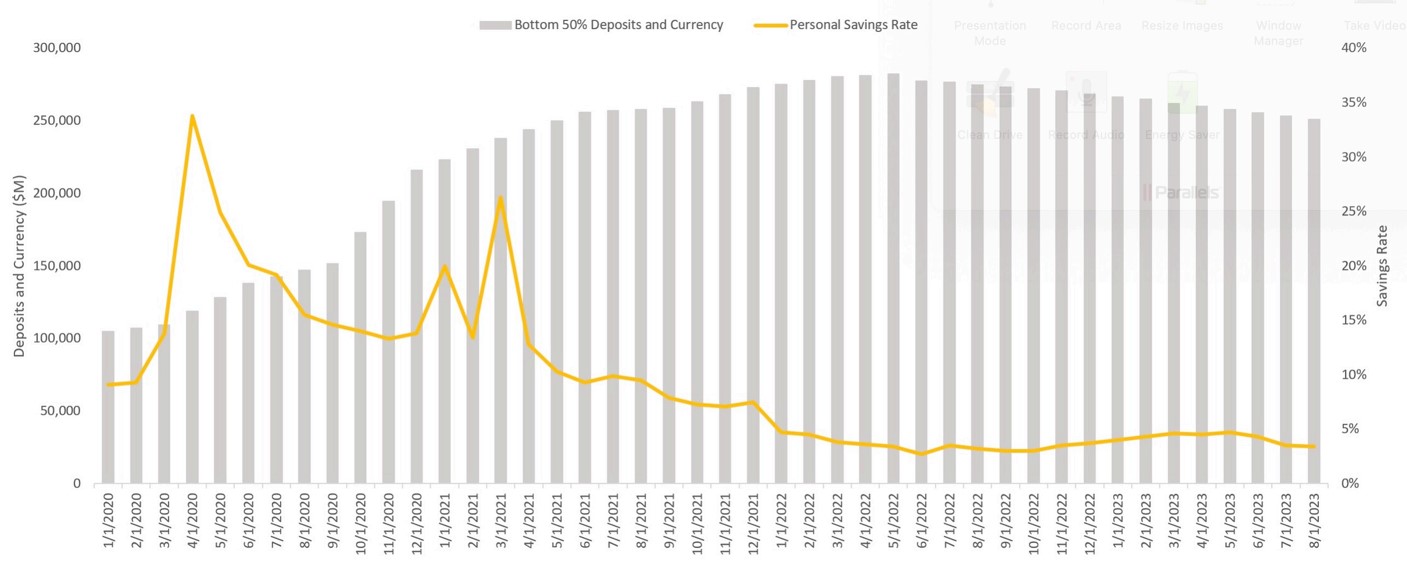
While the savings rate serves as a valuable indicator, it falls short in revealing the depth of cash accumulation. Contrary to widely reported savings rates, a closer look at the Federal Reserve’s Currency and Checkable Deposits data uncovers a more robust and sustainable financial position for the average US consumer. Comparing the cash availability evolution for the Bottom 50% and Top 50% of households reveals a significant uptick, with the former experiencing a 2.5x increase since January 2020 and the latter boasting a more substantial 3.5x surge.

Savings Rate vs. Currency and Checkable Deposits Bottom 50% of US Households

Charting the Course:
The provided charts depict the evolution of Currency and Checkable Deposits for both household groups. Notably, both segments began utilizing their accumulated cash, with the Bottom 50% initiating consumption in June 2022 and the Top 50% following suit in October 2022.
Average Consumer Balance Sheets:
Analyzing these data points underscores the resilience of the average US consumer balance sheets, with ample cash reserves and a prolonged trajectory before returning to pre-COVID levels. However, the sustainability of these balances varies by wealth decile, with wealthier households demonstrating a more protracted cash preservation period.
Erosion of Cash and Wealth Disparities:
It is crucial to acknowledge that these observations represent averages across all households, and the erosion of cash will likely manifest from the bottom up. The bottom 50% has already experienced negative growth, contrasting with the top 50%, signaling potential disparities in the impact of economic shifts. Less affluent households may face recessionary pressures while the broader economy remains relatively stable.
Forecasting Economic Trends:
While consumer balance sheets are not projected to be a significant driver of economic slowdown in the short term, factors like hiring trends, wages relative to inflation, and industrial output are expected to play more substantial roles in shaping the economic landscape. The intricate dynamics of wealth distribution and consumer behavior necessitate a comprehensive understanding for accurate forecasting of a recession or a “soft landing” scenario in the coming years.
See my blog post on Consumer Cash Balances and Credit Card Delinquencies here.
FAQs about this Blog Post
- What alternative data points challenge conventional perspectives on consumer finances, particularly regarding savings rates and cash accumulation? Contrary to widely reported savings rates, a closer examination of the Federal Reserve’s Currency and Checkable Deposits data reveals a more robust and sustainable financial position for the average US consumer. This analysis uncovers a significant uptick in cash accumulation, with both the Bottom 50% and Top 50% of households experiencing substantial increases since January 2020, indicating a deeper reservoir of cash than previously acknowledged.
- How do the provided charts depicting the evolution of Currency and Checkable Deposits for different household groups illustrate the consumer financial landscape? The provided charts illustrate the utilization of accumulated cash reserves by both household segments. While the Bottom 50% began consuming their accumulated cash in June 2022, the Top 50% followed suit in October 2022. These charts underscore the resilience of consumer balance sheets, with ample cash reserves and a prolonged trajectory before returning to pre-COVID levels, albeit varying by wealth decile.
- What insights does the analysis offer regarding the erosion of cash reserves and wealth disparities among different household segments? The analysis highlights the potential erosion of cash reserves, particularly among less affluent households, as negative growth has already been observed in the bottom 50%. This suggests potential disparities in the impact of economic shifts, with less affluent households facing recessionary pressures while the broader economy remains relatively stable. Understanding these dynamics is crucial for accurate forecasting of economic trends and addressing wealth disparities in the long term.
About me
With a focus on strategic financial leadership, my role as a CFO has been pivotal in guiding companies through periods of growth and transformation. My proficiency in analytics and data science empowers me to drive informed decision-making and optimize financial performance. Let’s connect on LinkedIn to discuss how my Fractional CFO expertise can contribute to your company’s success with CFO PRO+Analytics.

